


Dissolved Oxygen and Nanobubble Enhanced Aeration
Low dissolved oxygen (DO) limits biological activity in aquaculture, horticulture, and water treatment. Nanobubble technology solves this by adding two levels of oxygen to water: dissolved O2 and suspended gas cavities. This page covers DO fundamentals, saturation tables, and the role of enhanced aeration.
Introduction

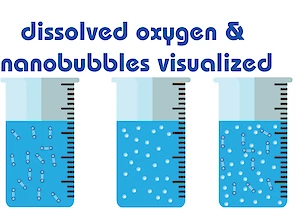
Dissolved oxygen, or DO, refers to the level of free, non-compound oxygen present in water or other liquids. The DO value is an essential parameter for your water quality, and for the process you use the water for. An ultrafine bubble, also known as a nanobubble, is not dissolved oxygen; a bubble is a gas cavity in water or another liquid.
Conventionally, aeration is a technology to increase the DO value in water. Now, with nanobubble technology, we have two levels to increase oxygen in water: dissolved oxygen and bubbles or gas cavities. For this reason, we also refer to nanobubble generation as an enhanced aeration technology.
The following factors influence the dissolved oxygen level:
The relationship between water temperature and DO is inverse: Cold Water can hold more DO than warm water. The ultrafine bubble generators on this website pressurize gases and liquids; therefore, they can oversaturate the water. In nature, under normal conditions, the saturation level is 100%.
Air contains 20.95% oxygen. At standard barometric pressure (760 mmHg), the pressure or 'tension' of oxygen in air is 159 mmHg (760 x 0.2095). The pressure of oxygen in air drives oxygen into water until the pressure of oxygen in water is equal to the pressure of oxygen in the atmosphere. When the pressure of oxygen in water and the atmosphere is equal, the net movement of oxygen molecules from the atmosphere to the water stops. The water is then in equilibrium, or at saturation, with dissolved oxygen (DO) when the oxygen pressure in the water equals the atmospheric oxygen pressure.
PPM versus mg / L
We often get the question about the difference between DO ppm and DO mg/L. At first glance, it appears to be two very different forms of measurement. They are both ratios, and to see how they align, it's easiest to start with ppm, or parts per million. As an example, let's say you're trying to determine the salinity of seawater, and you get a reading of 36,000 ppm; that means that for every million parts of water, there are 36,000 parts of salt.
What are the parts? Parts can be measured in any unit: liters, buckets, or a drop of water (such as orange juice or gasoline). The sample size is irrelevant. It's the RATIO of the tested parts (salt) to the total number of parts (seawater) that's important. It's easy to grasp ppm, but how about mg/L?
A liter of water (a metric unit of volume or capacity) weighs 1 kilogram. That's 1,000 grams. Now think about a milligram. It is 1/1000th of a gram, making it 1/1,000,000 th of a kilogram. Put another way, a liter of water weighs 1,000,000 milligrams. One million milligrams, see where this is going? For our purposes, 36,000 milligrams per liter is equivalent to 36,000 parts per million.* Both measurements tell us how many parts (milligrams) are present in every million parts (liters).
In reality, for these measurements to be perfectly equal, they must be taken with pure water at standard temperature and pressure. Most testing instruments include an automatic temperature compensation feature (ATC), which corrects for this difference.
DO values table
Dissolved oxygen values, saturation point, and oversaturated values
| Temperature | DO (mg/L) | DO (mg/L) | DO (mg/L) | DO (mg/L) | DO (mg/L) |
|---|---|---|---|---|---|
| (degrees C) | 100% | 200% | 300% | 400% | 500% |
| 0 | 14.6 | 29.2 | 43.8 | 58.4 | 73 |
| 1 | 14.19 | 28.38 | 42.57 | 56.76 | 70.95 |
| 2 | 13.81 | 27.62 | 41.43 | 55.24 | 69.05 |
| 3 | 13.44 | 26.88 | 40.32 | 53.76 | 67.2 |
| 4 | 13.09 | 26.18 | 39.27 | 52.36 | 65.45 |
| 5 | 12.75 | 25.5 | 38.25 | 51 | 63.75 |
| 6 | 12.43 | 24.86 | 37.29 | 49.72 | 62.15 |
| 7 | 12.12 | 24.24 | 36.36 | 48.48 | 60.6 |
| 8 | 11.83 | 23.66 | 35.49 | 47.32 | 59.15 |
| 9 | 11.55 | 23.1 | 34.65 | 46.2 | 57.75 |
| 10 | 11.27 | 22.54 | 33.81 | 45.08 | 56.35 |
| 11 | 11.01 | 22.02 | 33.03 | 44.04 | 55.05 |
| 12 | 10.76 | 21.52 | 32.28 | 43.04 | 53.8 |
| 13 | 10.52 | 21.04 | 31.56 | 42.08 | 52.6 |
| 14 | 10.29 | 20.58 | 30.87 | 41.16 | 51.45 |
| 15 | 10.07 | 20.14 | 30.21 | 40.28 | 50.35 |
| 16 | 9.85 | 19.7 | 29.55 | 39.4 | 49.25 |
| 17 | 9.65 | 19.3 | 28.95 | 38.6 | 48.25 |
| 18 | 9.45 | 18.9 | 28.35 | 37.8 | 47.25 |
| 19 | 9.26 | 18.52 | 27.78 | 37.04 | 46.3 |
| 20 | 9.07 | 18.14 | 27.21 | 36.28 | 45.35 |
| 21 | 8.9 | 17.8 | 26.7 | 35.6 | 44.5 |
| 22 | 8.72 | 17.44 | 26.16 | 34.88 | 43.6 |
| 23 | 8.56 | 17.12 | 25.68 | 34.24 | 42.8 |
| 24 | 8.4 | 16.8 | 25.2 | 33.6 | 42 |
| 25 | 8.24 | 16.48 | 24.72 | 32.96 | 41.2 |
| 26 | 8.09 | 16.18 | 24.27 | 32.36 | 40.45 |
| 27 | 7.95 | 15.9 | 23.85 | 31.8 | 39.75 |
| 28 | 7.81 | 15.62 | 23.43 | 31.24 | 39.05 |
| 29 | 7.67 | 15.34 | 23.01 | 30.68 | 38.35 |
| 30 | 7.54 | 15.08 | 22.62 | 30.16 | 37.7 |
| 31 | 7.41 | 14.82 | 22.23 | 29.64 | 37.05 |
| 32 | 7.28 | 14.56 | 21.84 | 29.12 | 36.4 |
| 33 | 7.16 | 14.32 | 21.48 | 28.64 | 35.8 |
| 34 | 7.05 | 14.1 | 21.15 | 28.2 | 35.25 |
| 35 | 6.93 | 13.86 | 20.79 | 27.72 | 34.65 |
| 36 | 6.82 | 13.64 | 20.46 | 27.28 | 34.1 |
| 37 | 6.71 | 13.42 | 20.13 | 26.84 | 33.55 |
| 38 | 6.61 | 13.22 | 19.83 | 26.44 | 33.05 |
| 39 | 6.51 | 13.02 | 19.53 | 26.04 | 32.55 |
| 40 | 6.41 | 12.82 | 19.23 | 25.64 | 32.05 |
| 41 | 6.31 | 12.62 | 18.93 | 25.24 | 31.55 |
| 42 | 6.22 | 12.44 | 18.66 | 24.88 | 31.1 |
| 43 | 6.13 | 12.26 | 18.39 | 24.52 | 30.65 |
| 44 | 6.04 | 12.08 | 18.12 | 24.16 | 30.2 |
| 45 | 5.95 | 11.9 | 17.85 | 23.8 | 29.75 |
Solubility of oxygen in water
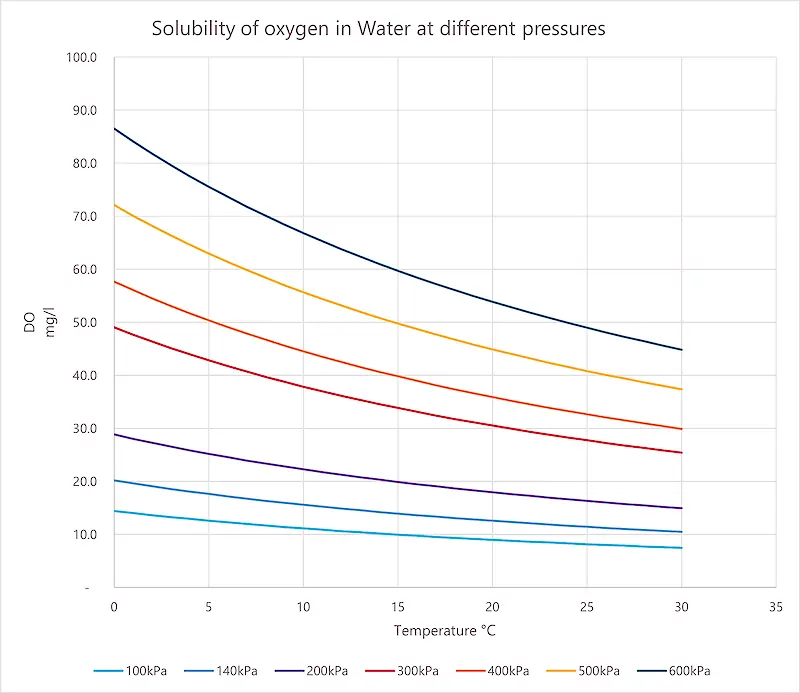
Graph the solubility of oxygen in water at different pressures. When selecting an oxygen concentrator, ensure it matches your desired pressure setting.
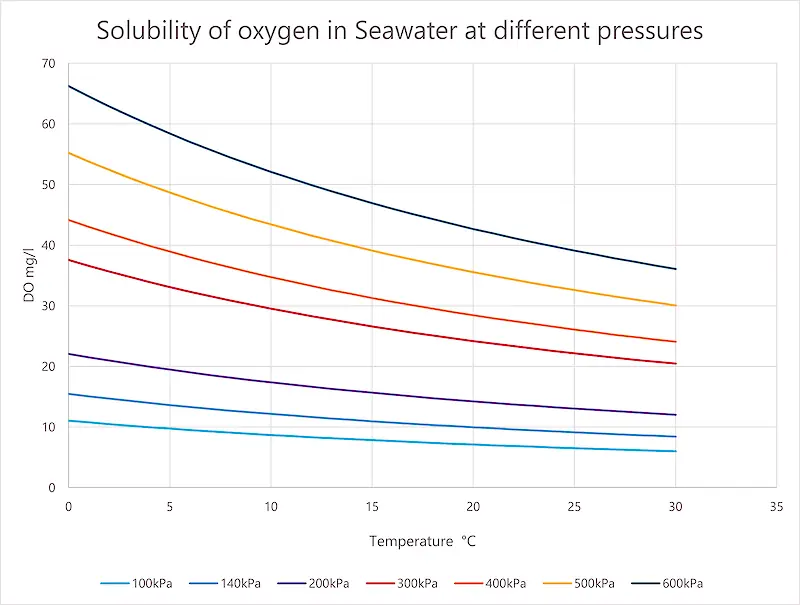
Graph the solubility of oxygen in seawater at different pressures. When a graph with different salinity is required, contact us for a calculation.
Approximate Breakdown of gases dissolved in water and in air
| Gas | Percentage in Air | Approx. % of Total Dissolved Gases in Water | Concentration (mg/L) |
|---|---|---|---|
| Nitrogen (N₂) | 78.1% | ~62–65% | ~13–14 mg/L |
| Oxygen (O₂) | 20.9% | ~30–34% | ~8–9 mg/L |
| Argon (Ar) | 0.93% | ~1.3% | ~0.4 mg/L |
| Carbon dioxide (CO₂) | ~0.04% | ~1.5–6% (varies widely) | ~0.5 mg/L (can be much higher in some water) |