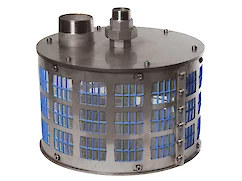
الأكسجين المذاب والفقاعات النانوية
مقدمة
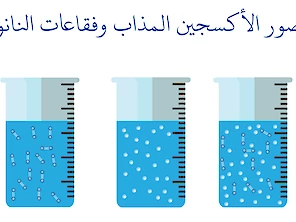
يشير الأكسجين المذاب، أو DO، إلى مستوى الأكسجين الحر غير المركب الموجود في الماء أو السوائل الأخرى. وتعد قيمة DO معلمة أساسية لجودة المياه والعملية التي تستخدم فيها المياه. والفقاعة متناهية الصغر، والمعروفة أيضًا باسم الفقاعة النانوية، ليست أكسجينًا مذابًا؛ فالفقاعة هي تجويف غازي في الماء أو سائل آخر.
تقليدياً، التهوية هي تقنية لزيادة قيمة DO في الماء. والآن، مع تقنية الفقاعات النانوية، لدينا مستويين لزيادة الأكسجين في الماء: المستوى الأول هو الأكسجين المذاب، والمستوى الثاني هو عبر الفقاعات أو التجاويف الغازية في الماء. ولهذا السبب، نشير أيضًا إلى توليد الفقاعات النانوية كتقنية تهوية معززة.
تؤثر العوامل التالية على مستوى الأكسجين المذاب:
- درجة حرارة الماء
- ملوحة الماء
- ارتفاع التشغيل (الضغط الجوي)
- تتأثر البيولوجيا في الماء بتنفس الأسماك والنباتات
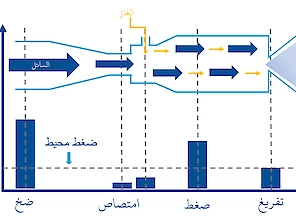
العلاقة بين درجة حرارة الماء و DO عكسية: يمكن للمياه الباردة أن تحتفظ بكمية أكبر من DO من المياه الدافئة. تضغط مولدات الفقاعات متناهية الصغر في هذا الموقع على الغازات والسوائل؛ وبالتالي، يمكن أن تزيد من تشبع الماء. في الطبيعة، في الظروف العادية، يكون مستوى التشبع 100٪ هو الحد الأقصى.
يحتوي الهواء على 20.95% من الأكسجين. وعند الضغط البارومتري القياسي (760 ملم زئبق)، يبلغ ضغط أو "توتر" الأكسجين في الهواء 159 ملم زئبق (760 × 0.2095). يدفع ضغط الأكسجين في الهواء الأكسجين إلى الماء حتى يصبح ضغط الأكسجين في الماء مساوياً لضغط الأكسجين في الغلاف الجوي. عندما يتساوى ضغط الأكسجين في الماء والغلاف الجوي، تتوقف الحركة الصافية لجزيئات الأكسجين من الغلاف الجوي إلى الماء. عندئذٍ يكون الماء في حالة توازن أو تشبع بالأكسجين المذاب (DO)، عندما يكون ضغط الأكسجين في الماء مساوياً لضغط الأكسجين في الغلاف الجوي.
جزء في المليون مقابل ملغم/لتر
كثيراً ما نتساءل عن الفرق بين DO جزء في المليون و DO ملغم/لتر. للوهلة الأولى، يبدو للوهلة الأولى أنهما شكلان مختلفان تمامًا للقياس. كلاهما نسب، ولمعرفة كيفية توافقهما مع بعضهما البعض، من الأسهل البدء بالجزء في المليون، أو جزء في المليون. على سبيل المثال، لنفترض أنك تحاول تحديد ملوحة مياه البحر، وتحصل على قراءة 36,000 جزء في المليون؛ وهذا يعني أنه لكل مليون جزء من الماء، هناك 36,000 جزء من الملح.
ما هي الأجزاء؟ يمكن قياس الأجزاء بأي وحدة: لتر أو دلو أو قطرة ماء (مثل عصير البرتقال أو البنزين). حجم العينة غير ذي صلة. المهم هو نسبة الأجزاء المختبرة (الملح) إلى العدد الإجمالي للأجزاء (ماء البحر). من السهل فهم جزء في المليون، ولكن ماذا عن ملغم/لتر؟
يزن لتر الماء (وهو مقياس متري للحجم أو السعة) 1 كيلوغرام. أي 1,000 جرام. والآن فكر في الملليغرام. إنه يساوي 1/1000 من الجرام، مما يجعله يساوي 1/1,000,000 من الكيلوجرام. وبعبارة أخرى، يزن لتر من الماء 1,000,000,000 ملليغرام. مليون ملليغرام ... أترى إلى أين يقودنا هذا؟ بالنسبة لأغراضنا، فإن 36,000 ملليغرام في اللتر الواحد يعادل 36,000 جزء من المليون.* كلا القياسين يخبرنا بعدد الأجزاء (الملليغرامات) الموجودة في كل مليون جزء (لتر).
في الواقع، لكي يكون هذان القياسان متساويين تمامًا، يجب أن يتم أخذهما بماء نقي عند درجة حرارة وضغط قياسيين. تتضمن معظم أدوات الاختبار ميزة التعويض التلقائي لدرجة الحرارة (ATC)، والتي تصحح هذا الاختلاف.
جدول قيم DO
قيم الأكسجين المذاب ونقطة التشبع وقيم التشبع الزائد
| درجة الحرارة | DO (ملغم/لتر) | DO (ملغم/لتر) | DO (ملغم/لتر) | DO (ملغم/لتر) | DO (ملغم/لتر) |
|---|---|---|---|---|---|
| (درجة مئوية) | 100% | 200% | 300% | 400% | 500% |
| 0 | 14.6 | 29.2 | 43.8 | 58.4 | 73 |
| 1 | 14.19 | 28.38 | 42.57 | 56.76 | 70.95 |
| 2 | 13.81 | 27.62 | 41.43 | 55.24 | 69.05 |
| 3 | 13.44 | 26.88 | 40.32 | 53.76 | 67.2 |
| 4 | 13.09 | 26.18 | 39.27 | 52.36 | 65.45 |
| 5 | 12.75 | 25.5 | 38.25 | 51 | 63.75 |
| 6 | 12.43 | 24.86 | 37.29 | 49.72 | 62.15 |
| 7 | 12.12 | 24.24 | 36.36 | 48.48 | 60.6 |
| 8 | 11.83 | 23.66 | 35.49 | 47.32 | 59.15 |
| 9 | 11.55 | 23.1 | 34.65 | 46.2 | 57.75 |
| 10 | 11.27 | 22.54 | 33.81 | 45.08 | 56.35 |
| 11 | 11.01 | 22.02 | 33.03 | 44.04 | 55.05 |
| 12 | 10.76 | 21.52 | 32.28 | 43.04 | 53.8 |
| 13 | 10.52 | 21.04 | 31.56 | 42.08 | 52.6 |
| 14 | 10.29 | 20.58 | 30.87 | 41.16 | 51.45 |
| 15 | 10.07 | 20.14 | 30.21 | 40.28 | 50.35 |
| 16 | 9.85 | 19.7 | 29.55 | 39.4 | 49.25 |
| 17 | 9.65 | 19.3 | 28.95 | 38.6 | 48.25 |
| 18 | 9.45 | 18.9 | 28.35 | 37.8 | 47.25 |
| 19 | 9.26 | 18.52 | 27.78 | 37.04 | 46.3 |
| 20 | 9.07 | 18.14 | 27.21 | 36.28 | 45.35 |
| 21 | 8.9 | 17.8 | 26.7 | 35.6 | 44.5 |
| 22 | 8.72 | 17.44 | 26.16 | 34.88 | 43.6 |
| 23 | 8.56 | 17.12 | 25.68 | 34.24 | 42.8 |
| 24 | 8.4 | 16.8 | 25.2 | 33.6 | 42 |
| 25 | 8.24 | 16.48 | 24.72 | 32.96 | 41.2 |
| 26 | 8.09 | 16.18 | 24.27 | 32.36 | 40.45 |
| 27 | 7.95 | 15.9 | 23.85 | 31.8 | 39.75 |
| 28 | 7.81 | 15.62 | 23.43 | 31.24 | 39.05 |
| 29 | 7.67 | 15.34 | 23.01 | 30.68 | 38.35 |
| 30 | 7.54 | 15.08 | 22.62 | 30.16 | 37.7 |
| 31 | 7.41 | 14.82 | 22.23 | 29.64 | 37.05 |
| 32 | 7.28 | 14.56 | 21.84 | 29.12 | 36.4 |
| 33 | 7.16 | 14.32 | 21.48 | 28.64 | 35.8 |
| 34 | 7.05 | 14.1 | 21.15 | 28.2 | 35.25 |
| 35 | 6.93 | 13.86 | 20.79 | 27.72 | 34.65 |
| 36 | 6.82 | 13.64 | 20.46 | 27.28 | 34.1 |
| 37 | 6.71 | 13.42 | 20.13 | 26.84 | 33.55 |
| 38 | 6.61 | 13.22 | 19.83 | 26.44 | 33.05 |
| 39 | 6.51 | 13.02 | 19.53 | 26.04 | 32.55 |
| 40 | 6.41 | 12.82 | 19.23 | 25.64 | 32.05 |
| 41 | 6.31 | 12.62 | 18.93 | 25.24 | 31.55 |
| 42 | 6.22 | 12.44 | 18.66 | 24.88 | 31.1 |
| 43 | 6.13 | 12.26 | 18.39 | 24.52 | 30.65 |
| 44 | 6.04 | 12.08 | 18.12 | 24.16 | 30.2 |
| 45 | 5.95 | 11.9 | 17.85 | 23.8 | 29.75 |
ذوبانية الأكسجين في الماء
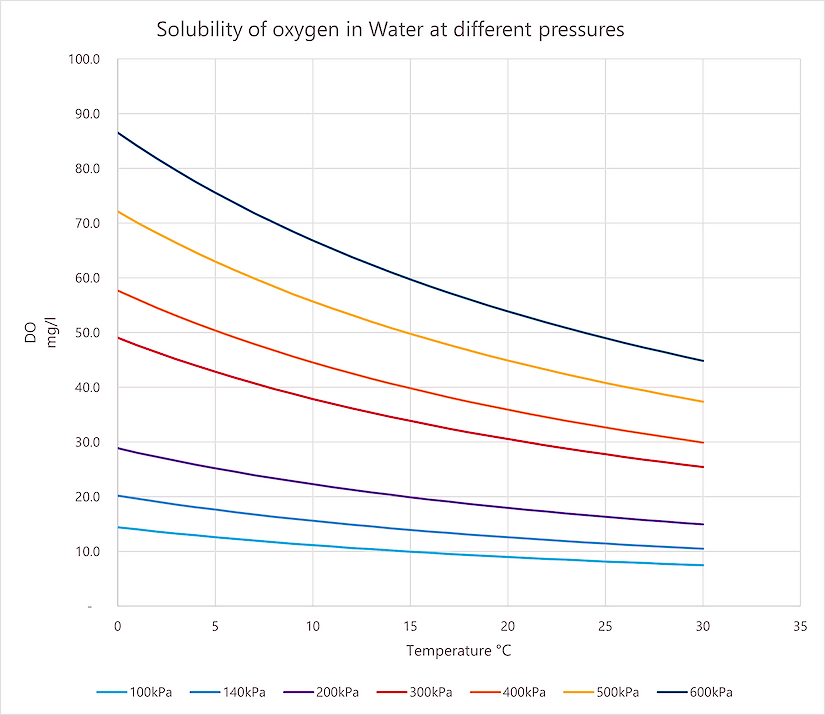
رسم بياني لقابلية ذوبان الأكسجين في الماء عند ضغوط مختلفة. عند اختيار مكثف الأكسجين، تأكد من مطابقته لإعدادات الضغط المطلوبة.
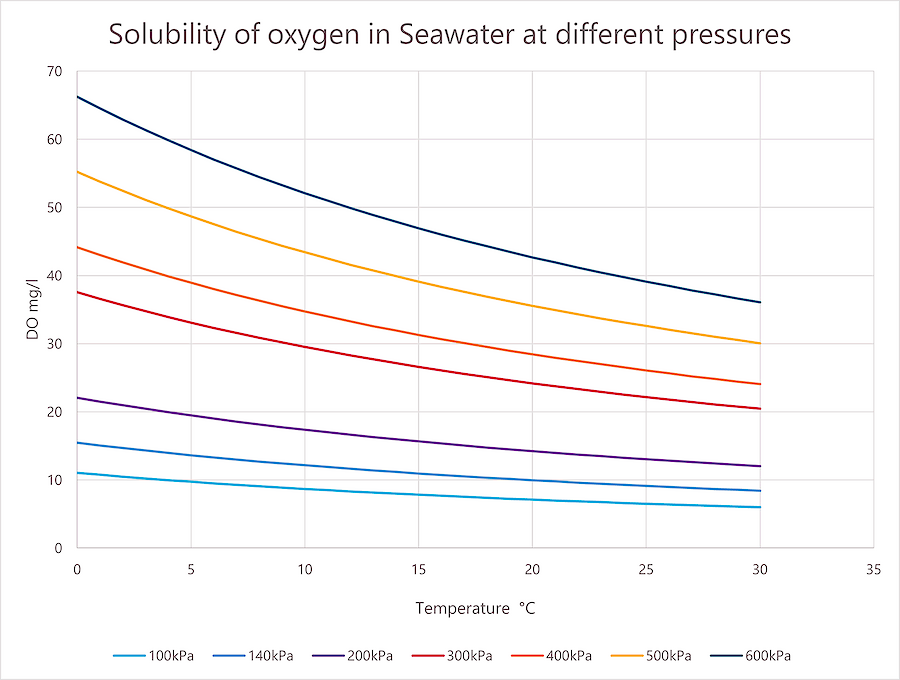
رسم بياني لذوبان الأكسجين في ماء البحر عند ضغوط مختلفة. عند الحاجة إلى رسم بياني بملوحة مختلفة، اتصل بنا لإجراء عملية حسابية.
التوزيع التقريبي للغازات الذائبة في الماء وفي الهواء
| الغازات | النسبة المئوية في الهواء | النسبة المئوية التقريبية لإجمالي الغازات الذائبة في الماء | التركيز (ملغم/لتر) |
|---|---|---|---|
| النيتروجين (N₂) | 78.1% | ~62-65% | ~13-14 ملغم/لتر |
| الأكسجين (O₂) | 20.9% | ~30-34% | ~8-9 ملغم/لتر |
| الأرجون (Ar) | 0.93% | ~1.3% | ~ 0.4 مجم/لتر |
| ثاني أكسيد الكربون (CO₂) | ~0.04% | ~1.5-6% (يختلف على نطاق واسع) | ~0.5 ملغم/لتر (يمكن أن يكون أعلى بكثير في بعض المياه) |
روابط
18 روابط لصفحات أخرى: الأكسجين المذاب
الفقاعات في كل مكان من حولنا ، في أطعمتنا ، والبيرة ، ومشروبات البوب ، والخبز والجبن ، ولكن أيضًا في أحجار منزلنا. الفقاعات عبارة عن تجاويف مملوءة بالغاز في الماء ، وعمر الفقاعة قصير على الأكثر لبضع دقائق ، فقط الفقاعات فائقة الدقة تكون ثابتة لفترات أطول مثل الأشهر ، وهذا يجعلها مميزة للغاية ويمكننا من تغيير خصائص ماء.
فقاعات النانو هي عبارة عن تجاويف مملوءة بالغاز في الماء. منطقة التلامس بين الفقاعات في الماء المليء بالفقاعات الصغيرة أكبر بكثير من المياه المليئة بالفقاعات الأكبر. يكون ضغط الغاز داخل الفقاعة الصغيرة أعلى منه في الفقاعة الكبيرة ، وبالتالي يكون التوتر السطحي للفقاعة الصغيرة أعلى أيضًا.
خس مانوا هو نوع من أنواع الخس المعرضة للإصابة بحروق الأطراف. حرق الأطراف هو تجفيف وموت أنسجة الأوراق على طول حواف الورقة. خلال اختبار في مزارع في هاواي تبين أنه من خلال زيادة مستويات الأكسجين المذاب وإضافة فقاعات متناهية الصغر يتم تقليل حروق الأطراف وتتحسن الجودة والإنتاج.
غالبًا ما يكون تكاثر الطحالب سببًا لبدء معالجة الأحواض. يمكن أن يؤدي استخدام البروبيوتيك مع الفقاعات فائقة الدقة إلى زيادة كفاءة عملية معالجة مياه الصرف الصحي. توفر أكنيتي البروبيوتيك على شكل أقراص بطريقة سهلة وآمنة لجرعة البكتيريا المفيدة وتطبيقها.
miniGaLF هو نموذج GaLF لمستوى المبتدئ الخاص بشركة أكنتي وهو مصمم للشركات والجامعات ومعاهد البحوث والأفراد الذين يرغبون في التعرف على تقنية الفقاعات فائقة الدقة. في هذه المدونة ، يتم عرض فيلم عن التوصيلات والأداء لإنشاء فقاعة متناهية الصغر (فقاعات نانو) ذات نسبة عالية من الأكسجين المذاب.
فقاعات النانو مفيدة في تسريع عملية التمثيل الغذائي للكائنات الحية، لكن الآلية ليست مفهومة جيدًا بعد. في دراسة، قاموا بالتحقيق في إنتاج أنواع الأكسجين التفاعلية (ROS) بواسطة فقاعات النانو وتأثيرها على إنبات البذور. كانت نتيجة الدراسة أن البذور الموجودة في ماء فقاعات النانو لها معدل إنبات أعلى من كل تلك المغمورة في المحاليل التقليدية الأخرى المستخدمة.
ورقة مواصفات أكنيتي: مراقبة الأكسجين المذاب والتحكم في العملية مُكثّف الأكسجين ومولد UFB
مضخة انزلاق توربيتي أوكسيجين هو مولد فقاعات متناهية الصغر متعدد الأغراض مناسب للزراعة والبستنة ومواقع تربية الأسماك. و يستخدم للتشبع الفائق للأكسجين لخزانات المياه اليومية في البستنة. ومحاليل مياه الشرب للدجاج والأبقار والخنازير والخيول ، مما يمنح الحيوانات نسبة عالية من الأكسجين المذاب مع فقاعات متناهية الصغر مع تعزيز هضم الطعام بشكل أكثر كفاءة ويؤدي إلى حيوانات أكثر صحة.
نظام التحكم في الأكسجين المذاب: جهاز التحكم في الأكسجين المذاب للتطبيقات التي تتطلب دقة عالية لمستويات الأكسجين المذاب مثل تربية الأحياء المائية وتهوية معالجة المياه. بالاقتران مع وحدة التحكم الأكسجين المذاب ، يمكنك تحقيق بيئة مثالية مع توفير الطاقة عن طريق تشغيل الجهاز لأدنى المطلوب بالإعدادات.
يستخدم مزارعو أزهار القرنفل في اليابان تقنية ري فقاعات النانو ضد الفيوزاريوم والنباتات الذائبة والمحتضرة لتحسين جودة الساق وحجم الزهرة وعدد النبتات وحجم السيقان وسرعة النمو. في موسم النمو 2017/2018 ، أجرت شركة أكنتي تجارب وكانت منطقة الاختبار تحتوي على مياه ري بمليارات من الفقاعات متناهية الصغر بمتوسط حجم 110 نانومتر ومياه DO عالية مع 30 مجم / لتر.
توربيتي أوكسجين هو مولد فقاعات متناهية الصغر متعدد الاستخدامات مناسب للزراعة والبستنة ومواقع تربية الأسماك. يشبع مياه التخزين اليومية بالأوكسجين في البستنة. حلول مياه الشرب للدجاج والأبقار والخنازير والخيول ، مما يمنح الحيوانات نسبة عالية من الأكسجين المذاب مع فقاعات متناهية الصغر مع تعزيز هضم الطعام بشكل أكثر كفاءة ويؤدي إلى حيوانات أكثر صحة.
مولد فقاعات متناهية الصغر الغاطس كبير الحجم مع مولد أكسجين مذاب، لتهوية البحيرات والبستنة وأحواض الأسماك واستزراع الجمبري بشكل فعال. تعتبر التهوية بالنسبة للعديد من العمليات البيولوجية مهمة جدًا ، حيث تضمن وحدة أكنيتي الغاطسة قيمًا عالية من الأكسجين المذاب للأنشطة البيولوجية المثالية التي تخلق بيئة مثالية لإنتاج إنتاجية عالية.
أجرت شركة Foreport، الشريكة ل Acniti في تايوان ، تجربة زراعة نباتات شابة للخضروات المروية بأكسجين فقاعات النانو. يحتوي ماء الري بأكسجين فقاعات النانو على 20 جزء في المليون مقابل مياه الري العادية التي تحتوي على 6.8 جزء في المليون. بعد 6 أسابيع من النتائج تم التوصل إلى أن المحصول المعالج بفقاعات النانو كان 25-30٪ أثقل. كان للمحصول المروى بفقاعات النانو أيضًا نظام جذر أفضل تطورًا مما سيؤدي إلى تقليل أمراض الجذور ومعدلات بقاء أفضل خلال فصل الصيف الحار.
في معبد به خندق مائي جميل في كيوتو اليابان كان يوجد مجموعة من المتطوعين الذين يحافظون على الخندق من خلال تنظيفه وإجراء الصيانة الدورية له. نظرًا لعمر المتطوعين الأكبر سنًا أوقفت المجموعة صيانة الخندق حوالي عام 1998. في العشرين عامًا التالية ، لم يتم إجراء أي صيانة، وسنة بعد أخرى، ساء الوضع من ناحية لم تتم إزالة التلوث الطبيعي مثل الأوراق في الخريف والإفراط في السيطرة على الخندق حدث نمو النباتات المائية. من ناحية أخرى، كانت السياحة في كيوتو في ازدياد وازدادت القمامة في الخندق المائي. أدى هذا إلى حالة لا يمكن السيطرة عليها من الرائحة الكريهة ونفوق الأسماك والمياه غير الشفافة وكان قاع الخندق غير مرئي. في الصيف أصبحت تكاثر الطحالب أكثر تكرارا.
الماء هو أحد المكونات الأساسية للحياة. يتكون جزء كبير من الخلايا الحية من الماء. تحتاج الطيور إلى ضعف كمية الماء التي يحتاجها الطعام الذي تأكله. لسد حاجة الدواجن والطيور إلى الماء يجب أن تجعل الماء متاحًا لهم مجانًا. لاحظ أن عدم توافر المياه التي تستهلكها الدواجن والقيود المفروضة عليها يبطئ نموها. يجب ألا تحتوي المياه المستخدمة في تغذية الدواجن على طفيليات أو بكتيريا أو ملوثات أو مواد كيميائية ويجب توفير مياه شرب نظيفة ونقية. تعتبر العوامل البكتيرية من أكثر أنواع العدوى التي تنقلها المياه شيوعًا. يمكن أن يتسبب شرب المياه الملوثة وغير المعالجة في خسائر فادحة في صناعة الدواجن. استخدام المواد الكيميائية والمضادات الحيوية لتطهير مياه الشرب يمكن أن يسبب مشاكل صحية ومقاومة للأدوية في الدجاج. في العقد الماضي ، حاول الباحثون إيجاد بديل مناسب لتطهير وتحسين جودة مياه الشرب لحيوانات المزرعة وخاصة الدجاج. تعتبر المياه فقاعات النانو من أكثر الخيارات المتاحة وأفضلها. من خلال توفير مياه فقاعات النانو بالأكسجين يزداد نمو وتطور الدجاج ومن ناحية أخرى، فإنه يعزز مقاومتها ضد الالتهابات الميكروبية. في هذه المقالة، نقوم بتقييم فوائد مياه أكسجين فقاعات النانو في صناعة الدواجن.
يلعب الأكسجين دورًا مهمًا في تنفس النبات، مما يؤدي إلى إنتاج الطاقة ونمو النبات. تؤدي زيادة نسبة الأكسجين في الماء إلى تحسين بنية الجذر ونشاط الميكروبات المفيدة في منطقة الجذور. بشكل طبيعي، يمكن للنظام الفعال والعملي زيادة الإنتاجية عن طريق تحسين جودة مياه الري وزيادة الأكسجين المذاب فيها. يعتبر مركز الأكسجين من Acniti ومضخة الأكسجين والأوزون Acniti Turbiti O3 مكملات فعالة جدًا لسقي الحقول الزراعية وفي الوقت نفسه تحسن جودة المياه وتزيد من نسبة الأكسجين المذاب (DO) والأوزون في مياه الري. تم إجراء بحث تجريبي لتحديد دور فقاعات النانو الأكسجين والأوزون في نمو الخس. أظهرت الدراسة أن استخدام مولدات فقاعات النانو من Acniti سيزيد من مستوى الأكسجين المذاب في الماء ويجعل جذور الخس تنمو بشكل أكبر ويزيد وزنها بش
الخرسانة هي الجزء الرئيسي من مواد البناء ويكاد يكون من المستحيل استبدال الخرسانة بالموارد الطبيعية الأخرى. وفقًا للعديد من المقالات العلمية، أدى تطبيق فقاعات النانو إلى تحسين مقاومة الانضغاط والشد للخرسانة. من ناحية أخرى ، فإن خليط الزيوليت، و البوزولان شيكنيه، و ماء فقاعات النانو يعمل على تحسين قوة ومتانة الخرسانة بشكل كبير، وهو بديل مفيد للأسمنت وخلط الماء لتقليل تلوث الهواء، وزيادة أداء الخرسانة، وتقليل تكاليف إنتاج الخرسانة. تقنية فقاعات النانو هي أفضل وأرخص وأبسط الطرق وأكثرها أمانًا لتحسين الخصائص الميكانيكية لمواد البناء.
